
Conservative politicians toss crime data red meat to base, yet high numbers might be a result of good police work
A conversation with UFV professor Irwin Cohen looking past the headlines, fear-mongering quotes, at the reality behind the data
If you read quotes from provincial and federal conservative politicians about crime in Chilliwack, you’ll be forgiven for wondering why you aren’t wading through dead bodies at Five Corners and fighting off purse-snatchers on the Vedder Trail.
“Chilliwack has the highest reported crime rate of any census metropolitan area in Canada,” Chilliwack-Fraser Canyon MP Mark Strahl shared on social media.
“It’s clear that Liberal soft-on-crime policies are making Canadians less safe, criminals less afraid, and our streets less secure.”
Read that one more time and think about it. Strahl blames Justin Trudeau for the fact that Chilliwack had the highest crime severity index (CSI) of all 42 census agglomeration areas in Canada in 2024.
“In that one piece of data, somehow Chilliwack is the highest in Canada and that is because of a policy of the Liberal government?” asked University of the Fraser Valley criminology professor Irwin Cohen in an interview with Something Worth Reading Thursday (July 25, 2025).
Politics notwithstanding, Cohen says it’s important to look at crime rates and other data over time, 10, 15, 20 years, to properly assess what is happening. There are numerous factors that go into the crime severity index that can make it artificially high one year compared to another: changes in definitions, laws, policing practices, investigative techniques, prosecutorial policy, even a change in climate can drive crime, according to Cohen.
The most elusive piece of the puzzle in assessing the reality around crime is the “dark figures,” which doesn’t refer to crime at night. It’s the unreported.
“Dark figures represent the difference between the amount of crime in a community and the amount of crime reported to police,” Cohen explained. “Sexual assault has a huge dark figure.”
The crime severity index has become a more reliable statistic than crime rates because it is calculated based on the proportion of sentences for a crime that result in incarceration and the average length of sentences.
Murder is weighed more seriously than sexual assault or fraud or shoplifting. But if people aren’t reporting sexual assaults or incidents of fraud or shoplifting, it doesn’t show up in the data.
Crime severity is “incredibly susceptible to reporting practices,” Cohen said.
Then there is the ironic reality that success on the front lines can look like failure in the headlines. If police forces and other agencies involved with criminal justice make changes that allow victims to feel safer or more confident to come forward and report crimes, we see more crime numbers.
“If you are doing a good enough job of making victims willing to report, the good news is, that’s great, you are going to be more aware of crime,” Cohen said. “The bad news in the short term is your crime rate is going to go up.”
It’s entirely possible that Chilliwack’s crime rate and crime severity index is higher than other similar-sized communities because of good police work and good connections in the community and with victims.
When it comes to the most serious types of sexual assaults, involving bodily harm, weapons, threats, Chilliwack registers a zero putting the city tied at 42 out of 42 CMAs in Canada. As for the most minor type of sexual assaults and sexual assaults against children, Chilliwack is sixth and second respectively.
Why? Maybe Chilliwack has a smaller dark figure than most other communities. But we don’t know. Dark is dark.
’Most dangerous city in Canada’ fear-mongering
Every year we see headlines about the crime rate or the crime severity index, and it’s clear that the media and the general public don’t really know what the CSI is, and it’s clear that politicians in power will take credit in good years and opposition politicians will point fingers in bad ones.
“How did we become the most dangerous city in Canada?" asked Heather Maahs, MLA for Chilliwack North in a fear-mongering news release from the local BC Conservative caucus. “This isn’t a blip. These numbers have been bad for years and the NDP still has no plan to turn it around.”
At least part of that is true. The numbers have been high for years. But only compared to some others and the provincial average.
“People are afraid to walk alone at night, properties are being broken into, and repeat offenders are cycling through the system with no accountability," said fellow BC Conservative Á’a:líya Warbus, MLA for Chilliwack–Cultus Lake. "The NDP has let public safety crumble, and their failed drug experiment is making it worse."
There are a few things to unpack there: a) There’s nothing in this data to draw a conclusion that people are more or less afraid to walk alone at night in this time and place than in others; b) Properties are being broken into, yes; c) Repeat offenders are cycling through the system with no accountability? Yes and no. There is accountability, some people just don’t agree with it. And repeat and prolific offenders do cycle through the system, but it’s a stretch to blame the elected government in Victoria on the topic of bail granted by judges who are following the law and federal policy, and sentences handed down by judges that align with the criminal code and precedents.
She might wish it otherwise, but if Heather Maahs rises to become leader of the BC Conservatives and eventually premier, she still can’t change federal laws or judicial practices.
'You can use statistics to prove anything'
The important piece to remember with statistics is they tell you something, but far from the whole story. And sometimes they are misleading. If municipalities and police forces use the CSI and crime rate data to enact policies to tackle specific crimes, great. If the numbers are used to make excuses or point blame or for political fodder, they're useless.
“How do [police forces and municipalities] understand it and how do they use it?” Cohen asked. “What do they do with the data that comes to them? That’s a much more interesting question.”
He also said a good way of finding out the dark figures is for municipalities to conduct victimization surveys where people are asked question about their last six months. Here people can anonymously say they were the victim of a sexual assault or their business was broken into, but they didn't report it because of X, Y, or Z. Offenders sometimes come out of the woodwork, too, admitting to driving drunk but not getting caught.
As for blaming or crediting federal or provincial political parties, there’s a difference between correlation and causation.
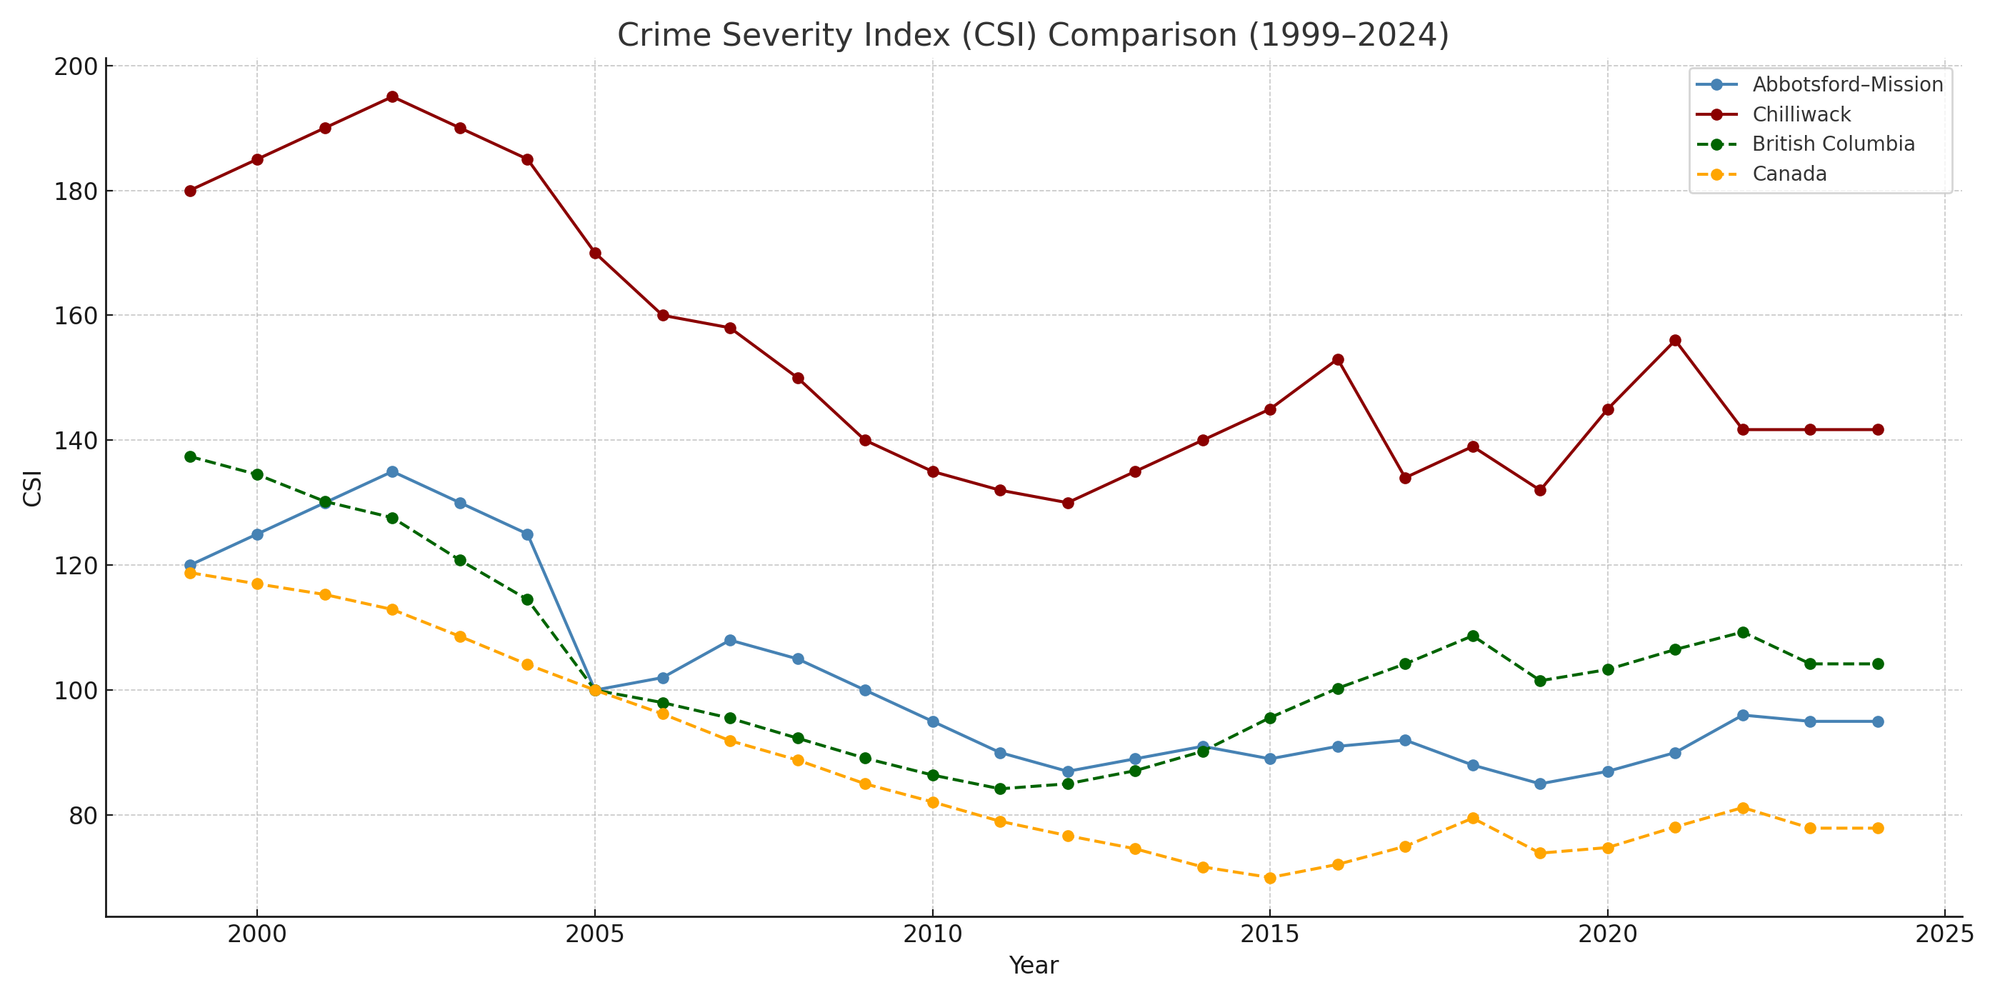
If you want to drill into it, the biggest three-year drop in Chilliwack’s CSI was while Paul Martin was prime minister, a Liberal, when it went from more than 190 to below 160. Then while Conservative Stephen Harper was prime minister, 2006 to 2015, the CSI in Chilliwack it dropped to about 130 in the middle of his term but then shot back up to 145 by the last year. The graph is shaped like a deflated letter ‘U.’ Between 2015 and 2024, while Trudeau’s Liberals have been in power the Chilliwack CSI is unchanged.
Provincially, the rate did drop during the period of rule by the (conservative) BC Liberals, 2001 to 2017 and, same story, under the NDP it’s been pretty flat.
What does all of that tell you? Not a hell of a lot.
The reality is that over the last 25 years, the crime severity index in Canada is down 35 per cent. In B.C., it's down 25 per cent, Abbotsford 21 per cent, Chilliwack 22 per cent.
Cohen uses the school system and crime as a metaphor to describe this use of correlation dressed up as causation.
“The best way we know how to socialize young people, to make them into Canadian citizens, is our formal school system,” he said. “By creating a formal school system, we have created people who fail in that system and the outcomes of failing are terrible."
A huge proportion of people convicted of crimes did poorly or didn't finish school.
“You could in theory say: Increases in crime are in part because of our school system.”
It just doesn’t fly.
The long-term trend in crime, however, as well as the long- long- long-term trend is that residents of the Fraser Valley and British Columbia and Canada and the entire planet are living in one of the safest periods of time in human history. That goes for most periods in the last 100 years, definitely the last 200 years, and especially compared to the brutality and instability of medieval times, according to historian Yuval Noah Harari.
Pretending otherwise is using statistics as a political weapon of fear-mongering.
Still, here are some numbers
Chilliwack is all over the map when you break down the CSI numbers crime by crime, which itself is an indicator there are hidden factors behind the statistics. Still, here are the top three cities for various crimes on a measure of incidents per 100,000 people and Chilliwack’s ranking, which sometimes is in the top three.
Assault: Most violent type, endangering life
1. Saskatoon
2. Edmonton
3. Regina
9. Chilliwack
Assaults involving a weapon, but with less serious outcomes.
1. Thunder Bay
2. Regina
3. Chilliwack
Level 1 the most minor, slapping, pushing, punching
1. Kamloops
2. Chilliwack
3. Lethbridge
Sexual assaults: Most serious
1. Regina
2. Belleville
3. Kelowna
42. Chilliwack (tied with 17 other cities at a rate of zero)
Sexual assaults: Serious, but less so
1. Saint John
2. Ottawa-Gatineau
3. Abbotsford-Mission
42. Chilliwack (tied only with Belleville)
Sexual assaults: Least serious, violating sexual integrity with no injury or violence
1. Thunder Bay
2. Red Deer
3. Trois-Riveres
6. Chilliwack
Sexual assaults against children
1. Drummondville
2. Chilliwack
3. Abbotsford-Mission
Child pornography: Possssion
1. Halifax
2. Brantford
3. Moncton
17. Chilliwack
Child pornography: Distribution
1. Chilliwack
2. Kamloops
3. Abbotsford-Mission
Robbery
1. Winnipeg
2. Thunder Bay
3. Saskatoon
8. Chilliwack
B&E
1. Winnipeg
2. Lethbridge
3. Kamloops
10. Chilliwack
Drugs
1. Lethbridge
2. Chilliwack
3. Nanaimo
Hate crimes
1. Fredericton (by far, three times that St. Johns)
2. St. John’s
3. Toronto
42. Chilliwack (tied with 18 others at zero)
Impaired driving
1. Red Deer
2. Abbotsford-Mission
3. Moncton
6. Chilliwack
Car theft
1. Red Deer
2. Winnipeg
3. Edmonton
14. Chilliwack
Human trafficking
1. Guelph
2. Thunder Bay
3. Moncton
42. Chilliwack (tied with seven others at zero)
-30-
Want to support independent journalism?
Consider becoming a paid subscriber or make a one-time donation so I can continue this work.
Paul J. Henderson
pauljhenderson@gmail.com
facebook.com/PaulJHendersonJournalist
instagram.com/wordsarehard_pjh
x.com/PeeJayAitch
wordsarehard-pjh.bsky.social